From raw data to site decisions.
Score markets, rank properties, explain what drives performance — all in one workspace.
Market Scoring
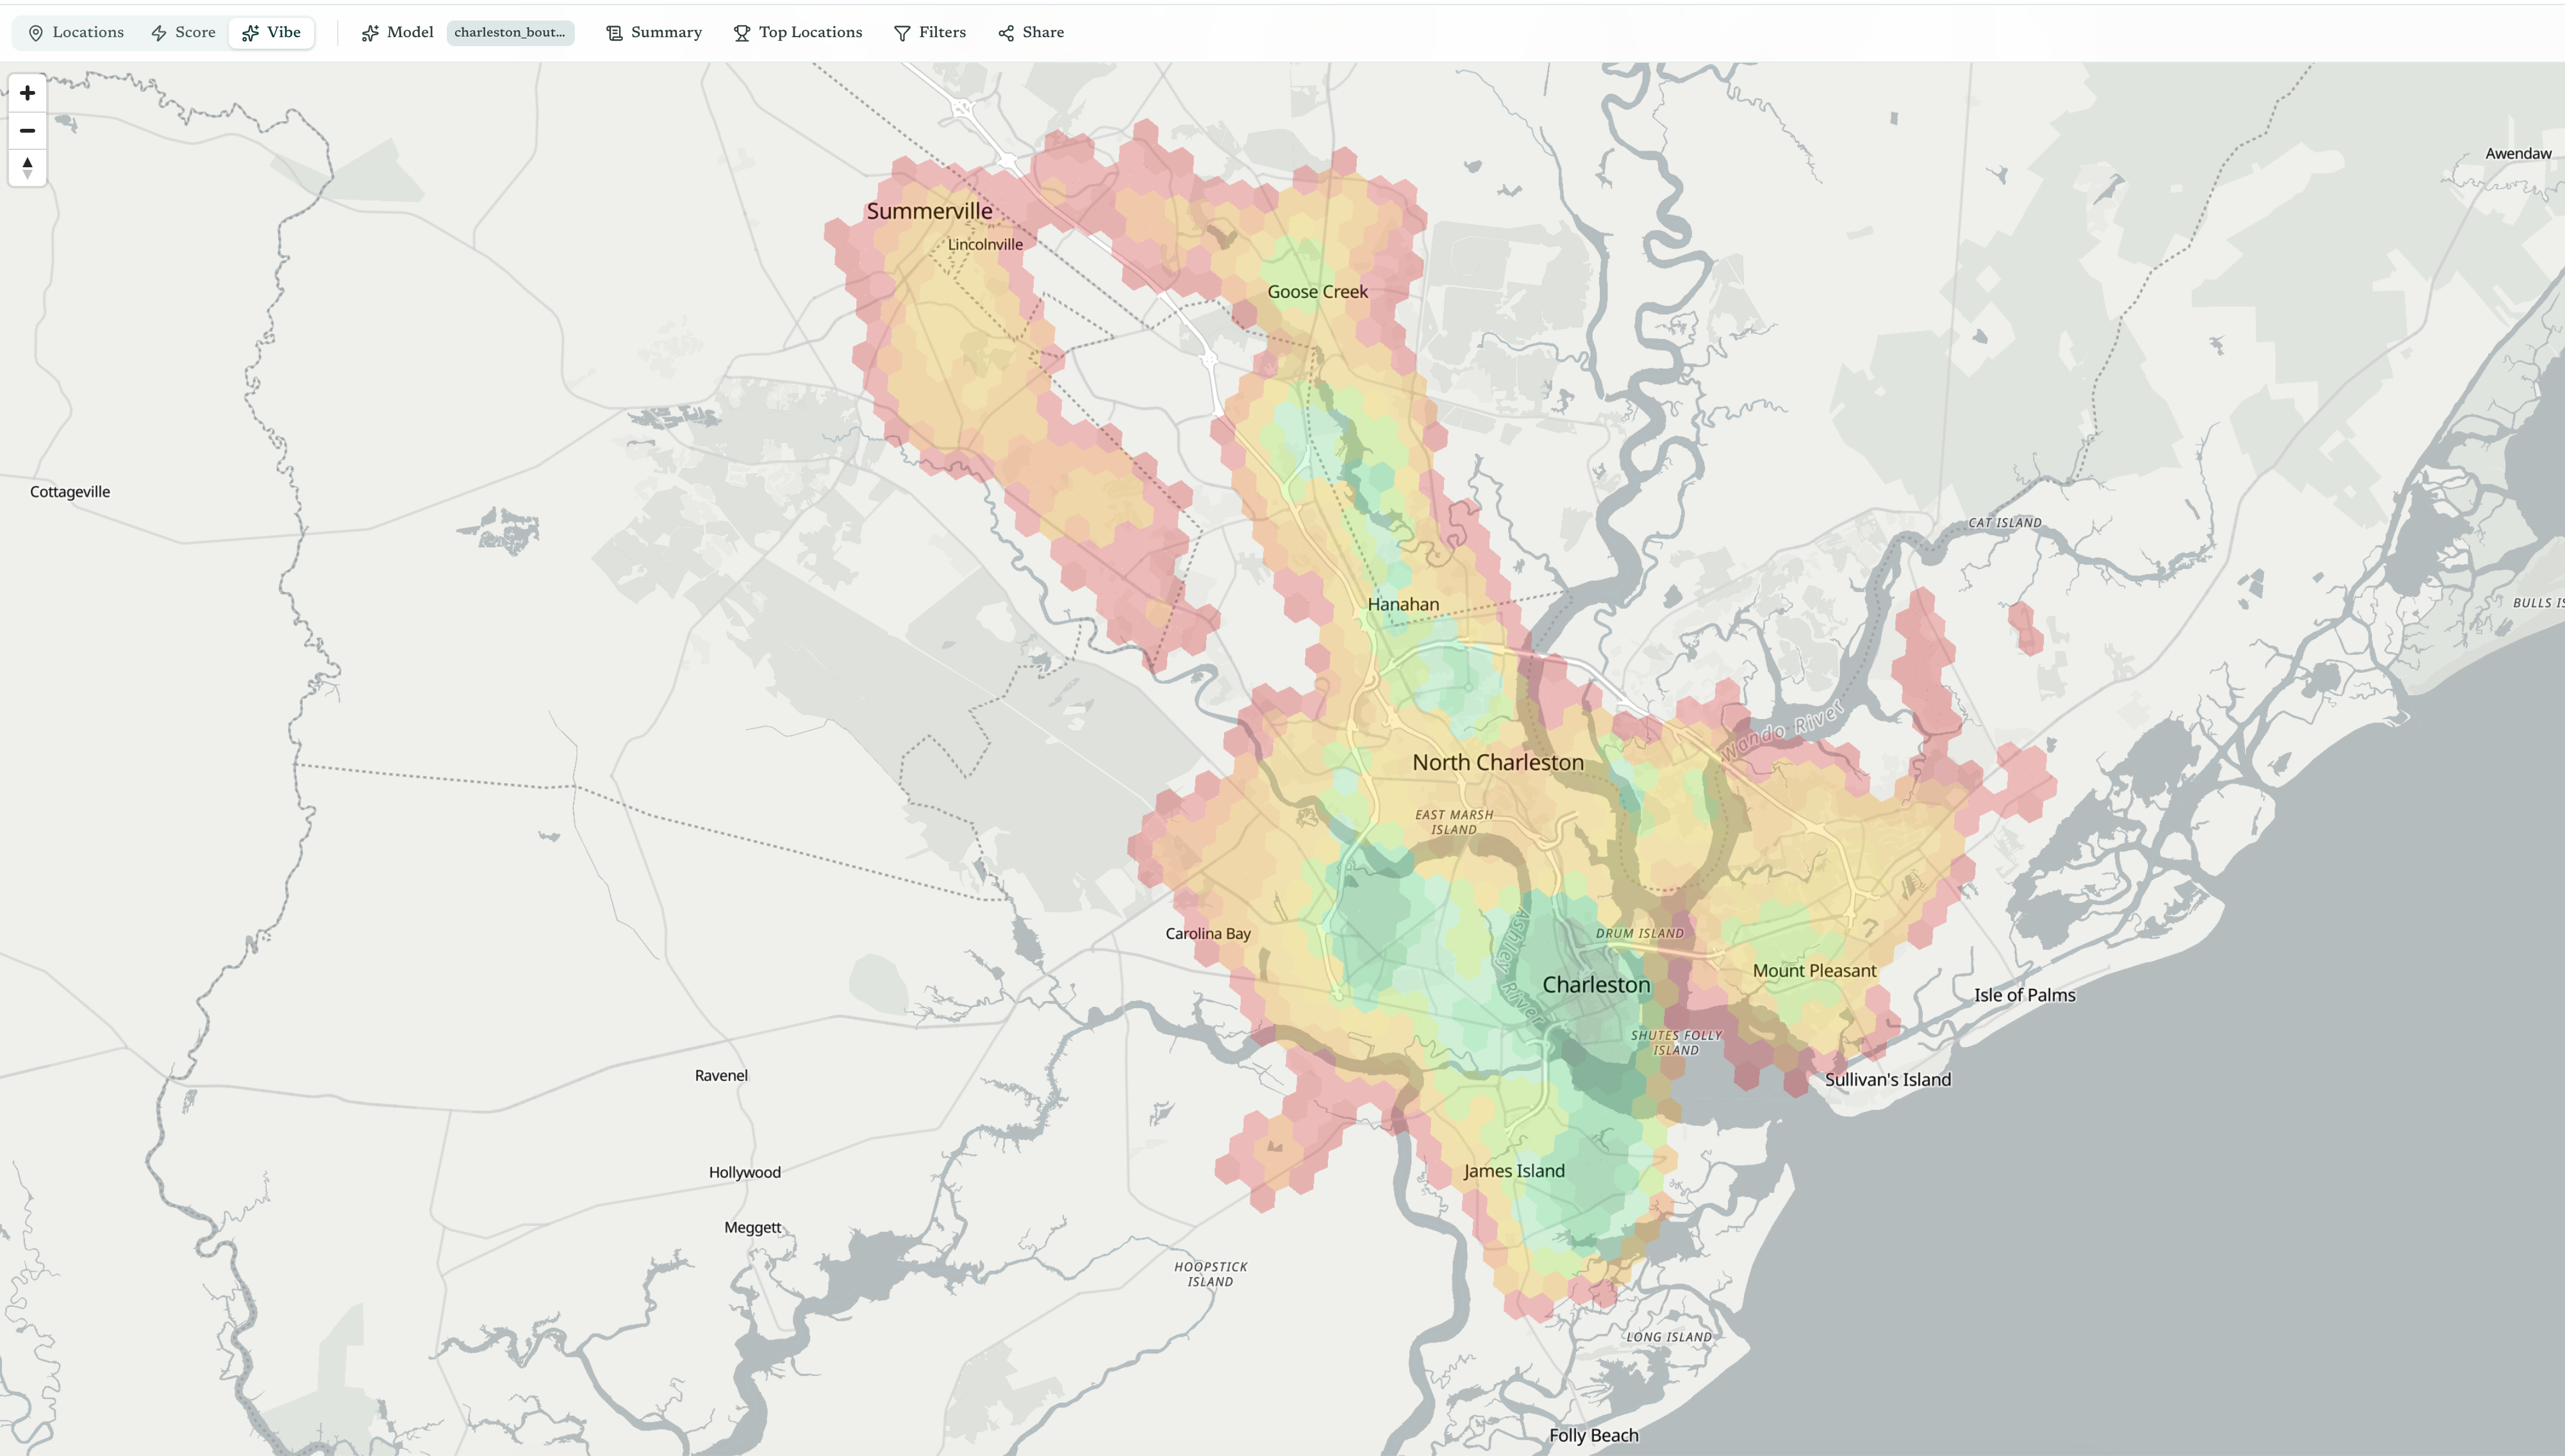
Every hex, scored and graded.
Build a vibe model from your ideal customer profile and score every hex
in any market. The grid lights up from green (best fit) to red (worst) — so you
can see the entire competitive landscape at a glance.
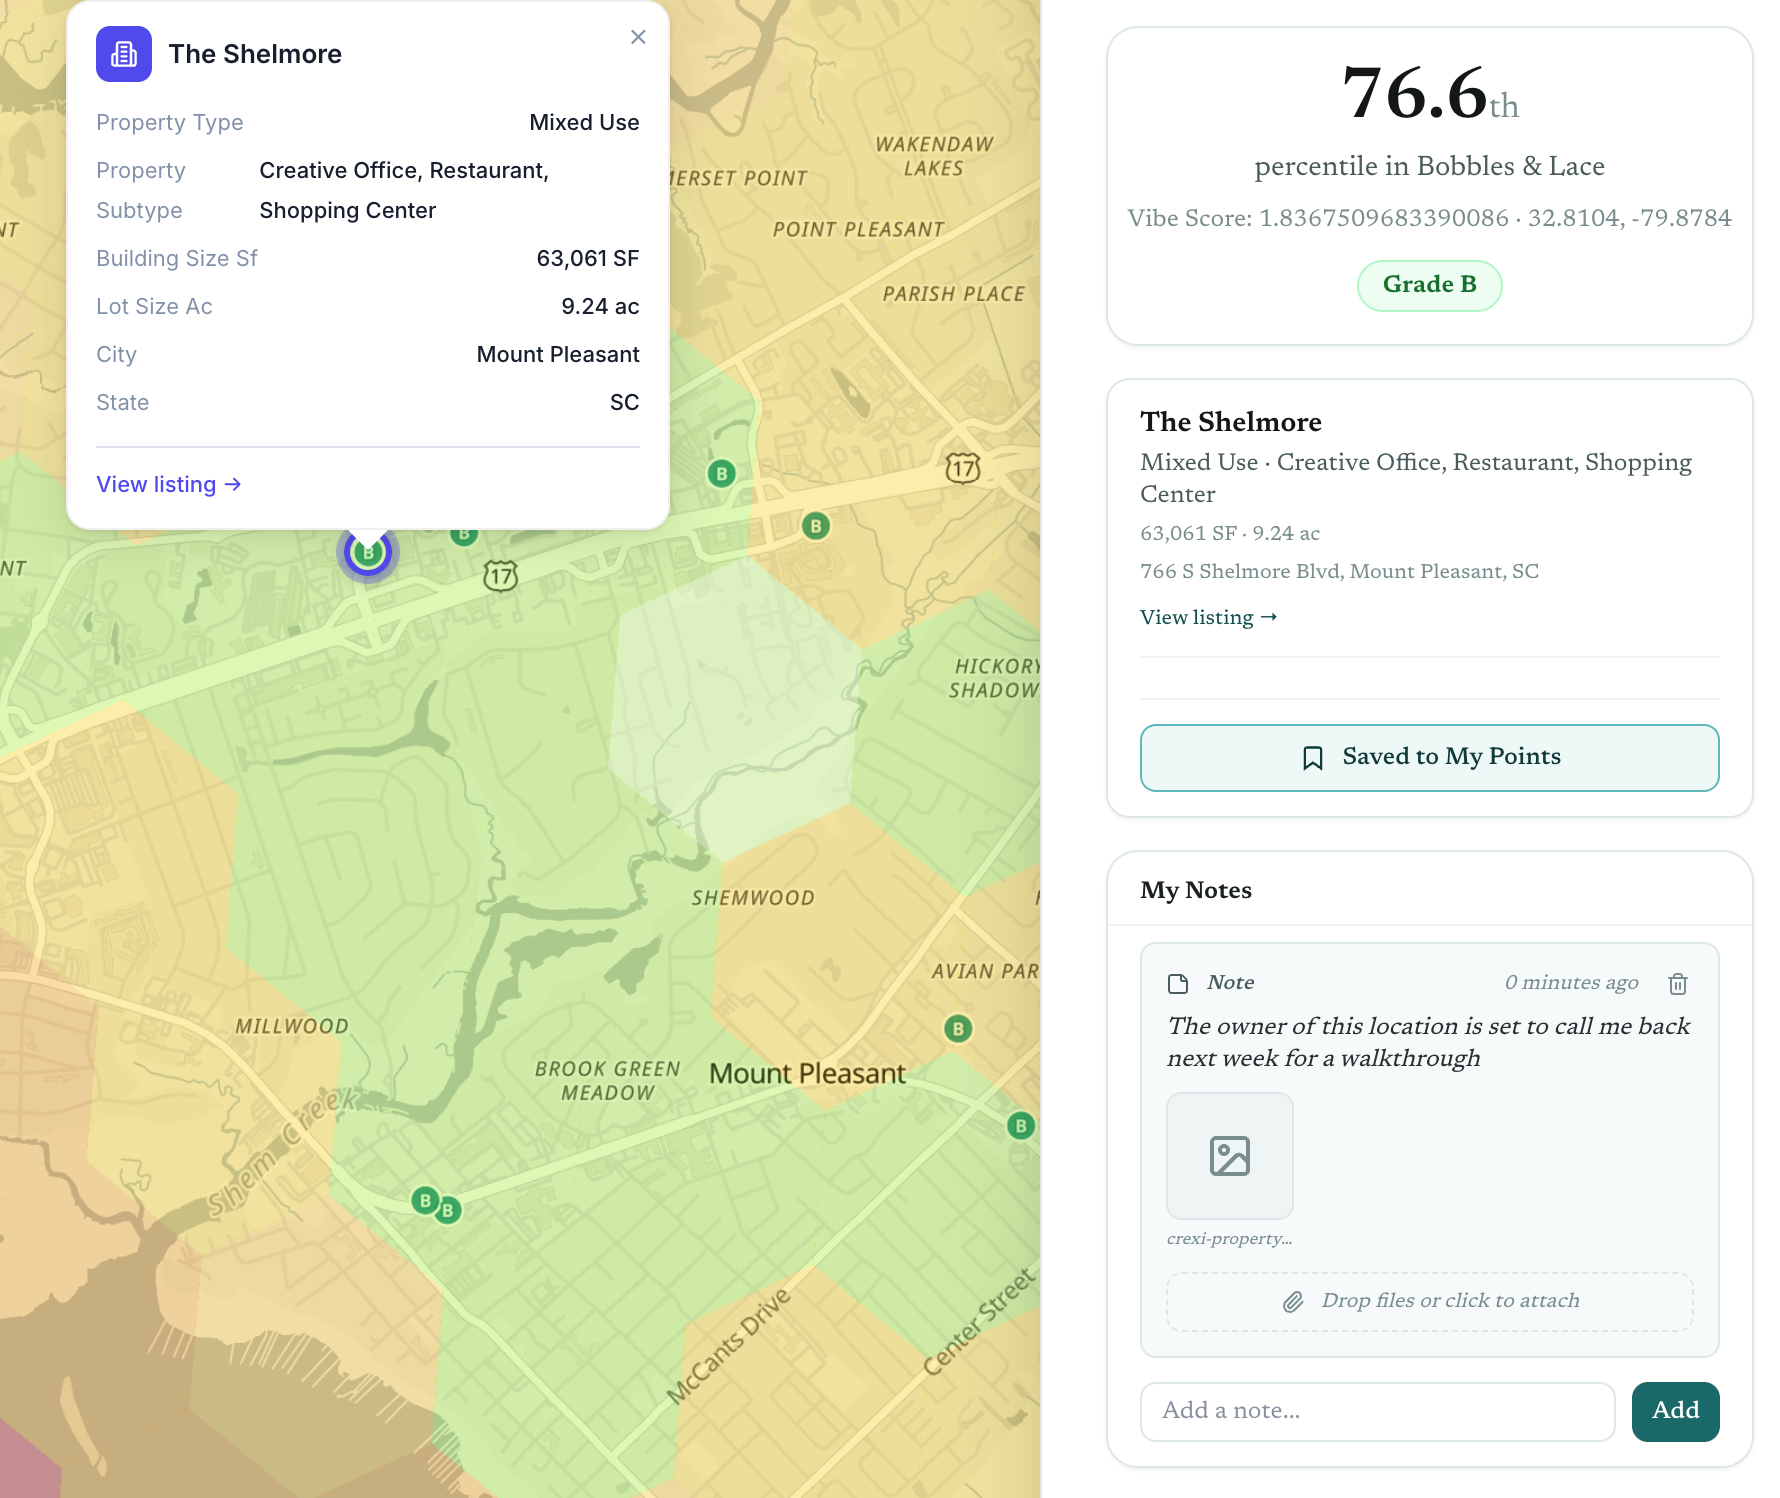
Property Scoring
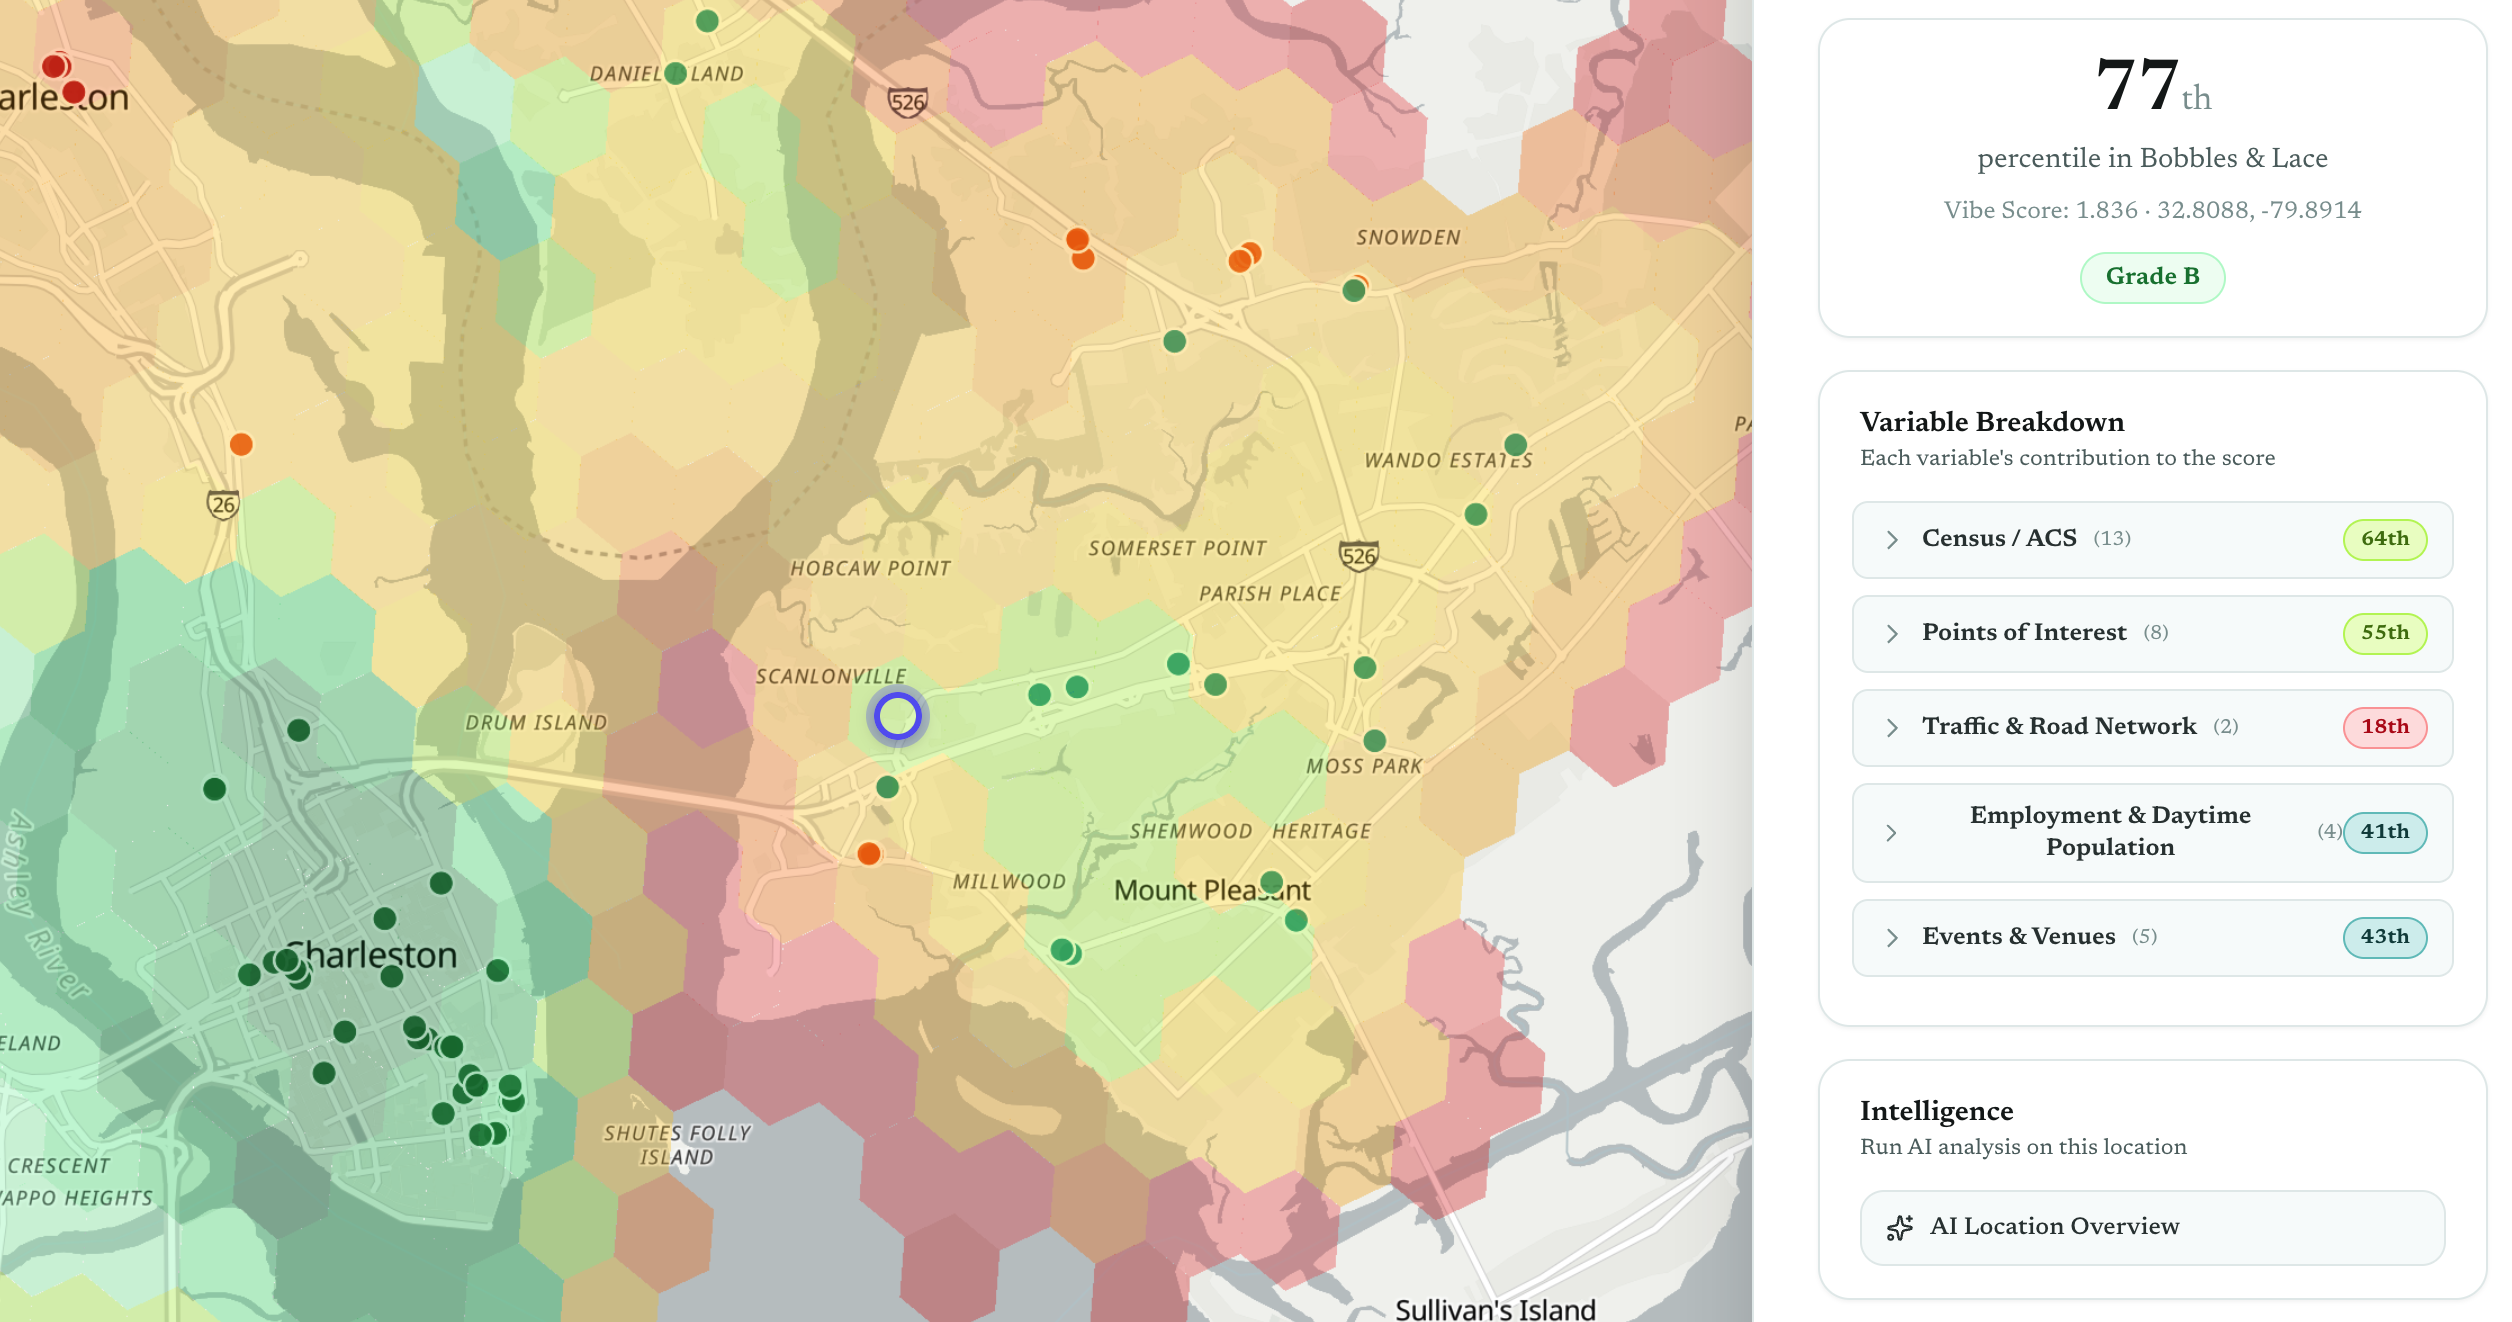
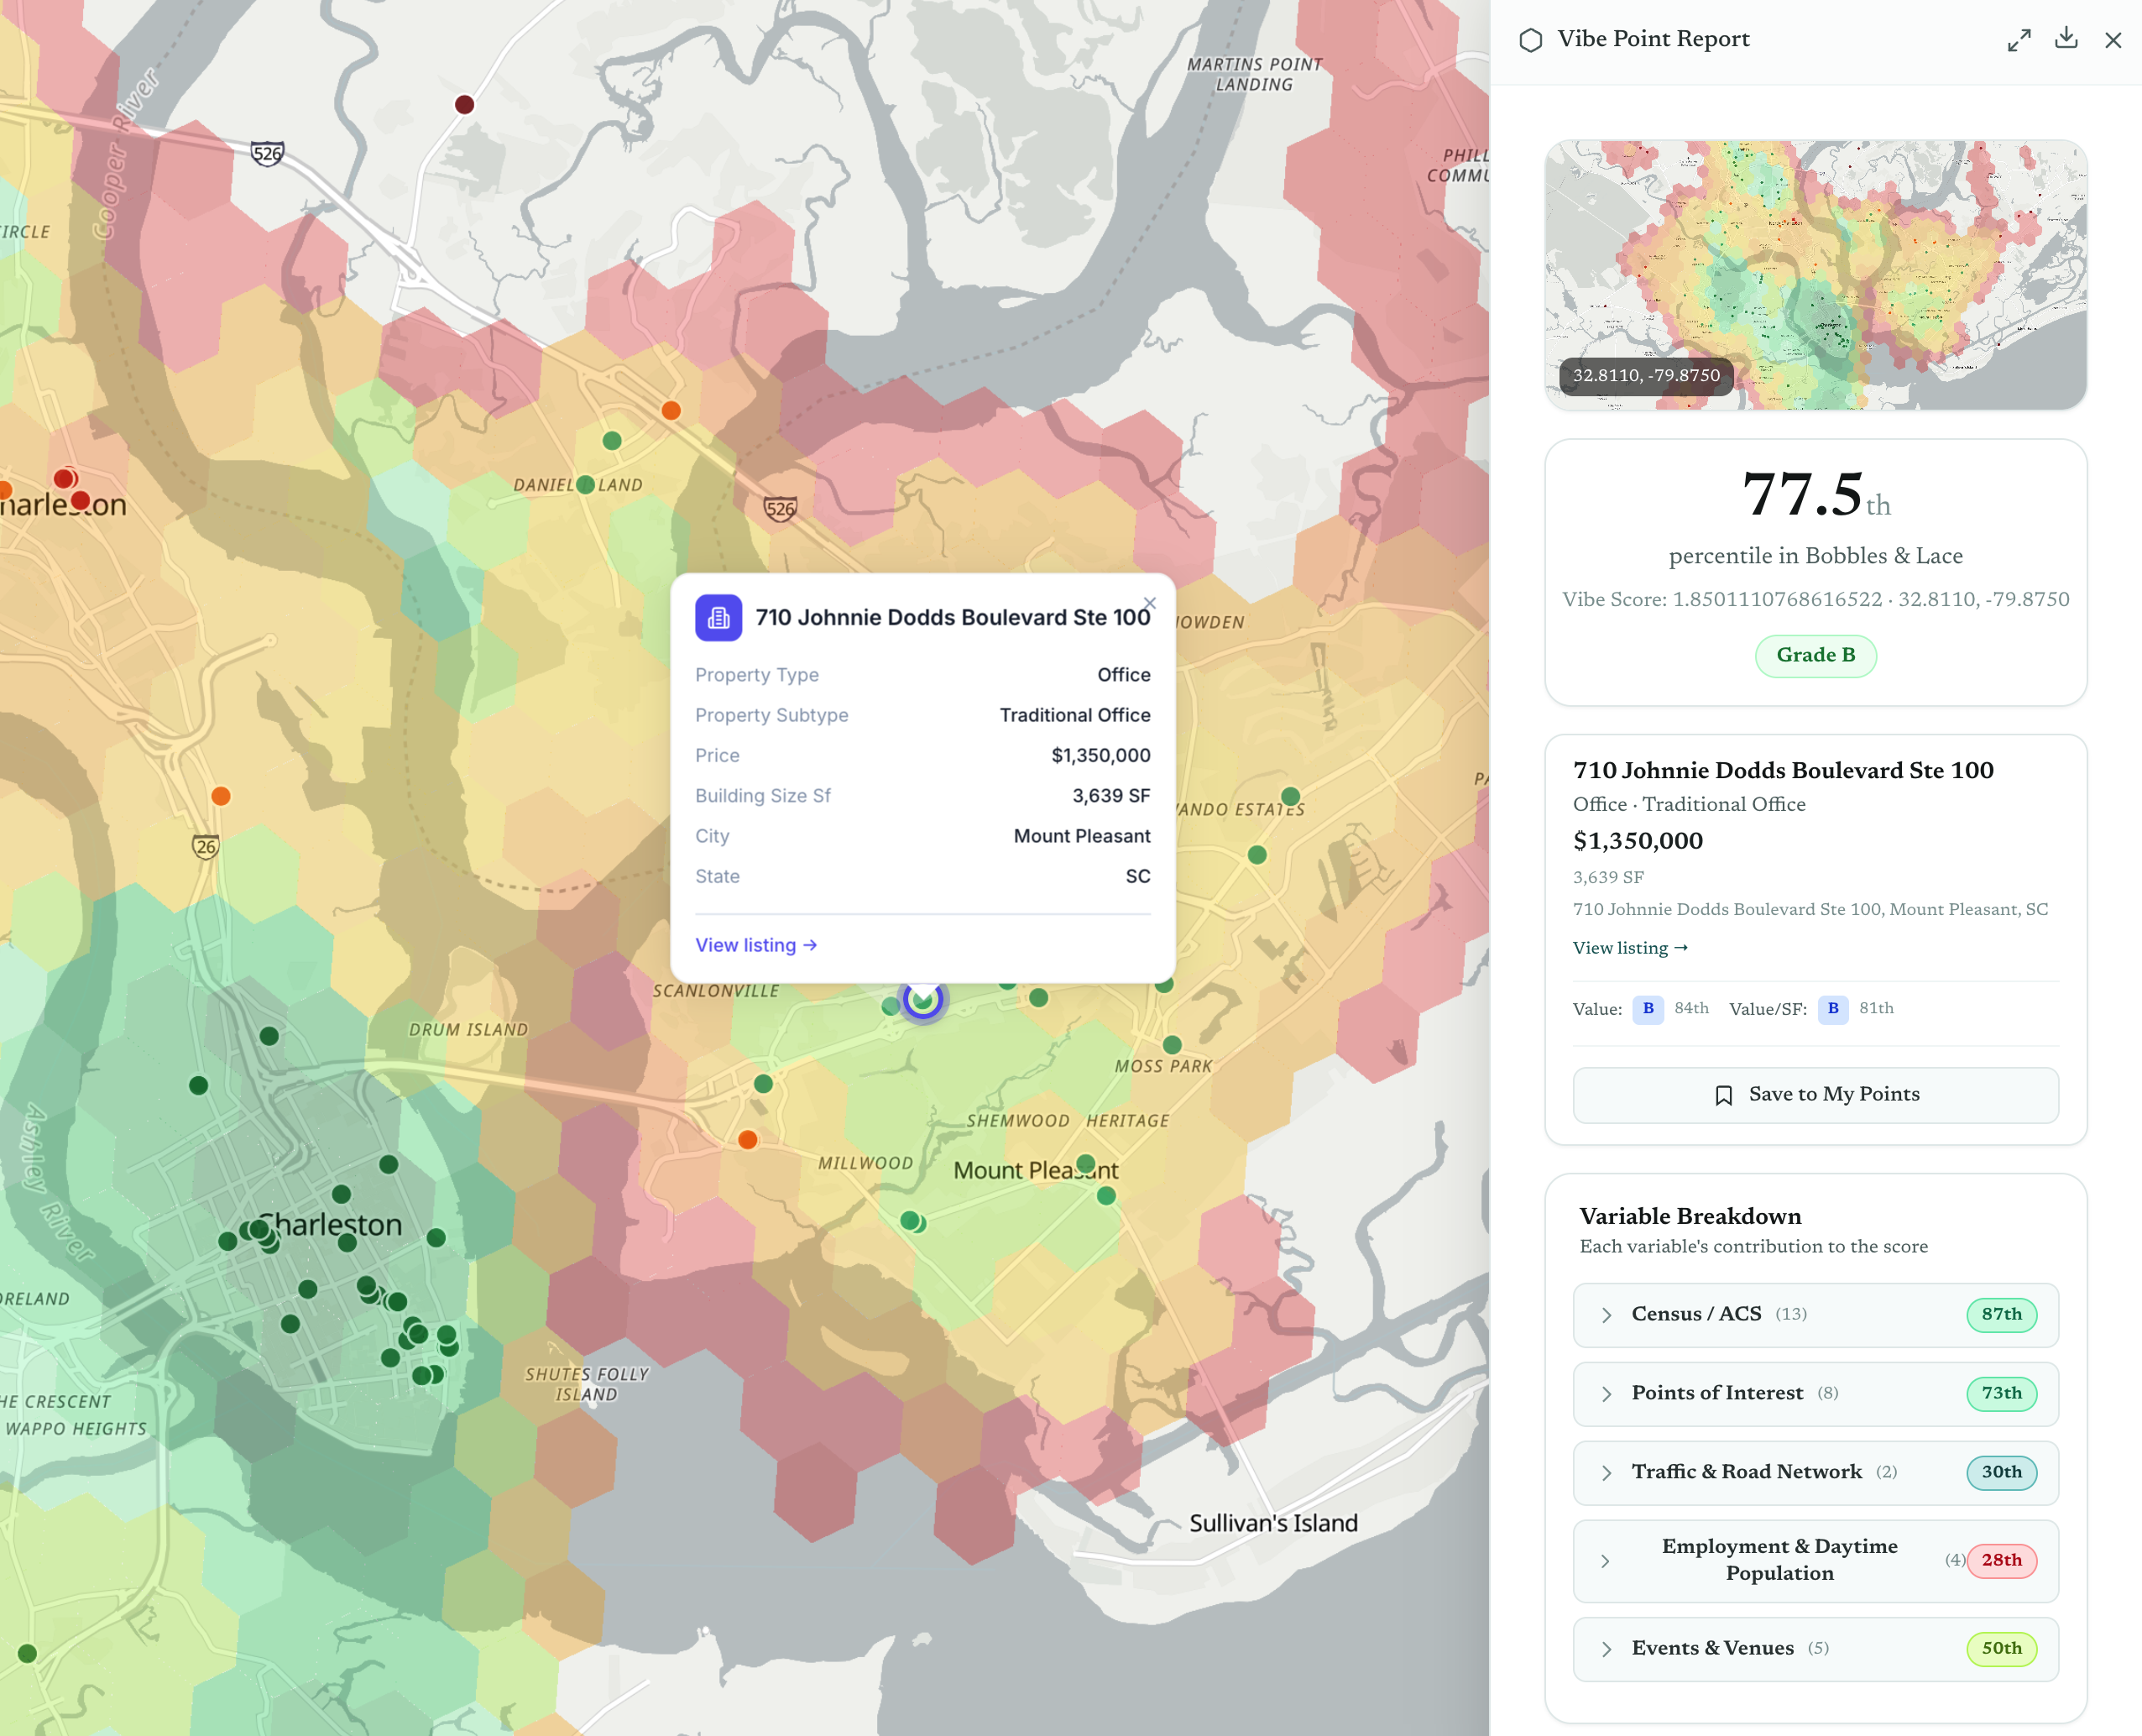
Grade real listings against your model.
Every CRE listing on the map gets a percentile score and letter grade — property type, price,
building size all in context. See exactly where it ranks across census, POI, traffic, and employment data.
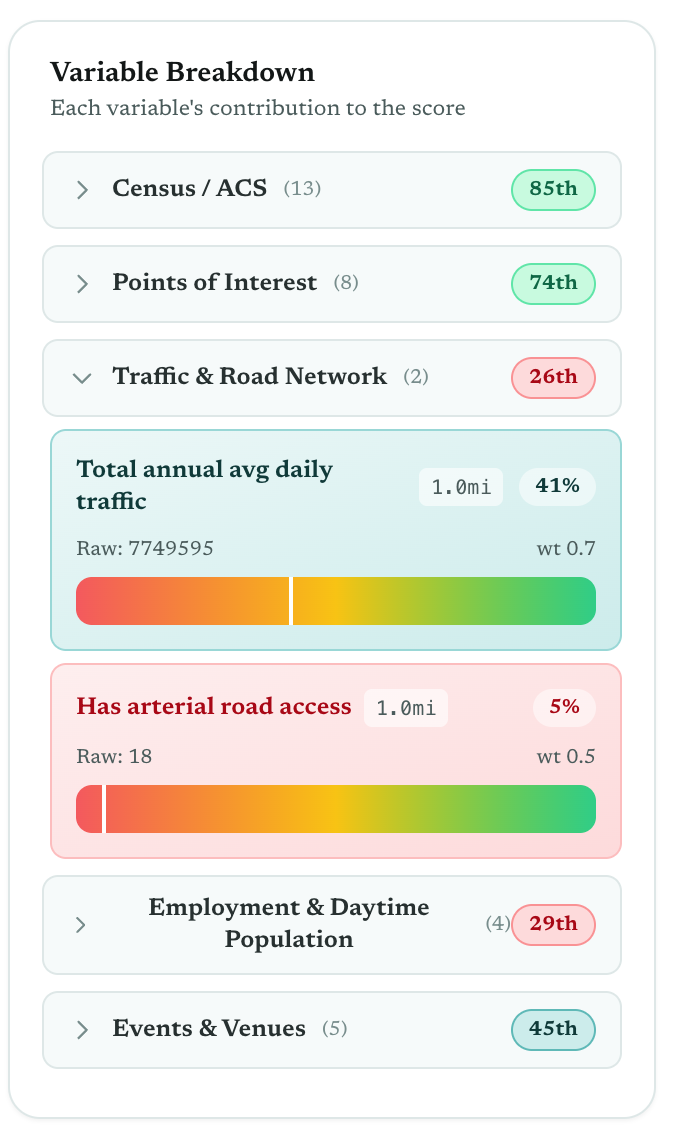
Variable Breakdown
See what's driving every score.
Expand any scored location to see per-variable percentile ranks across every data source.
Green means above average, red means below — so you know instantly whether a location's
weakness is traffic, income, or competition density.
Notes & My Points
Save locations. Add context. Track deals.
Bookmark any scored property to your saved points list. Attach notes, photos, and files —
keep your site visit observations right alongside the data. Everything stays linked to the
original score and listing.
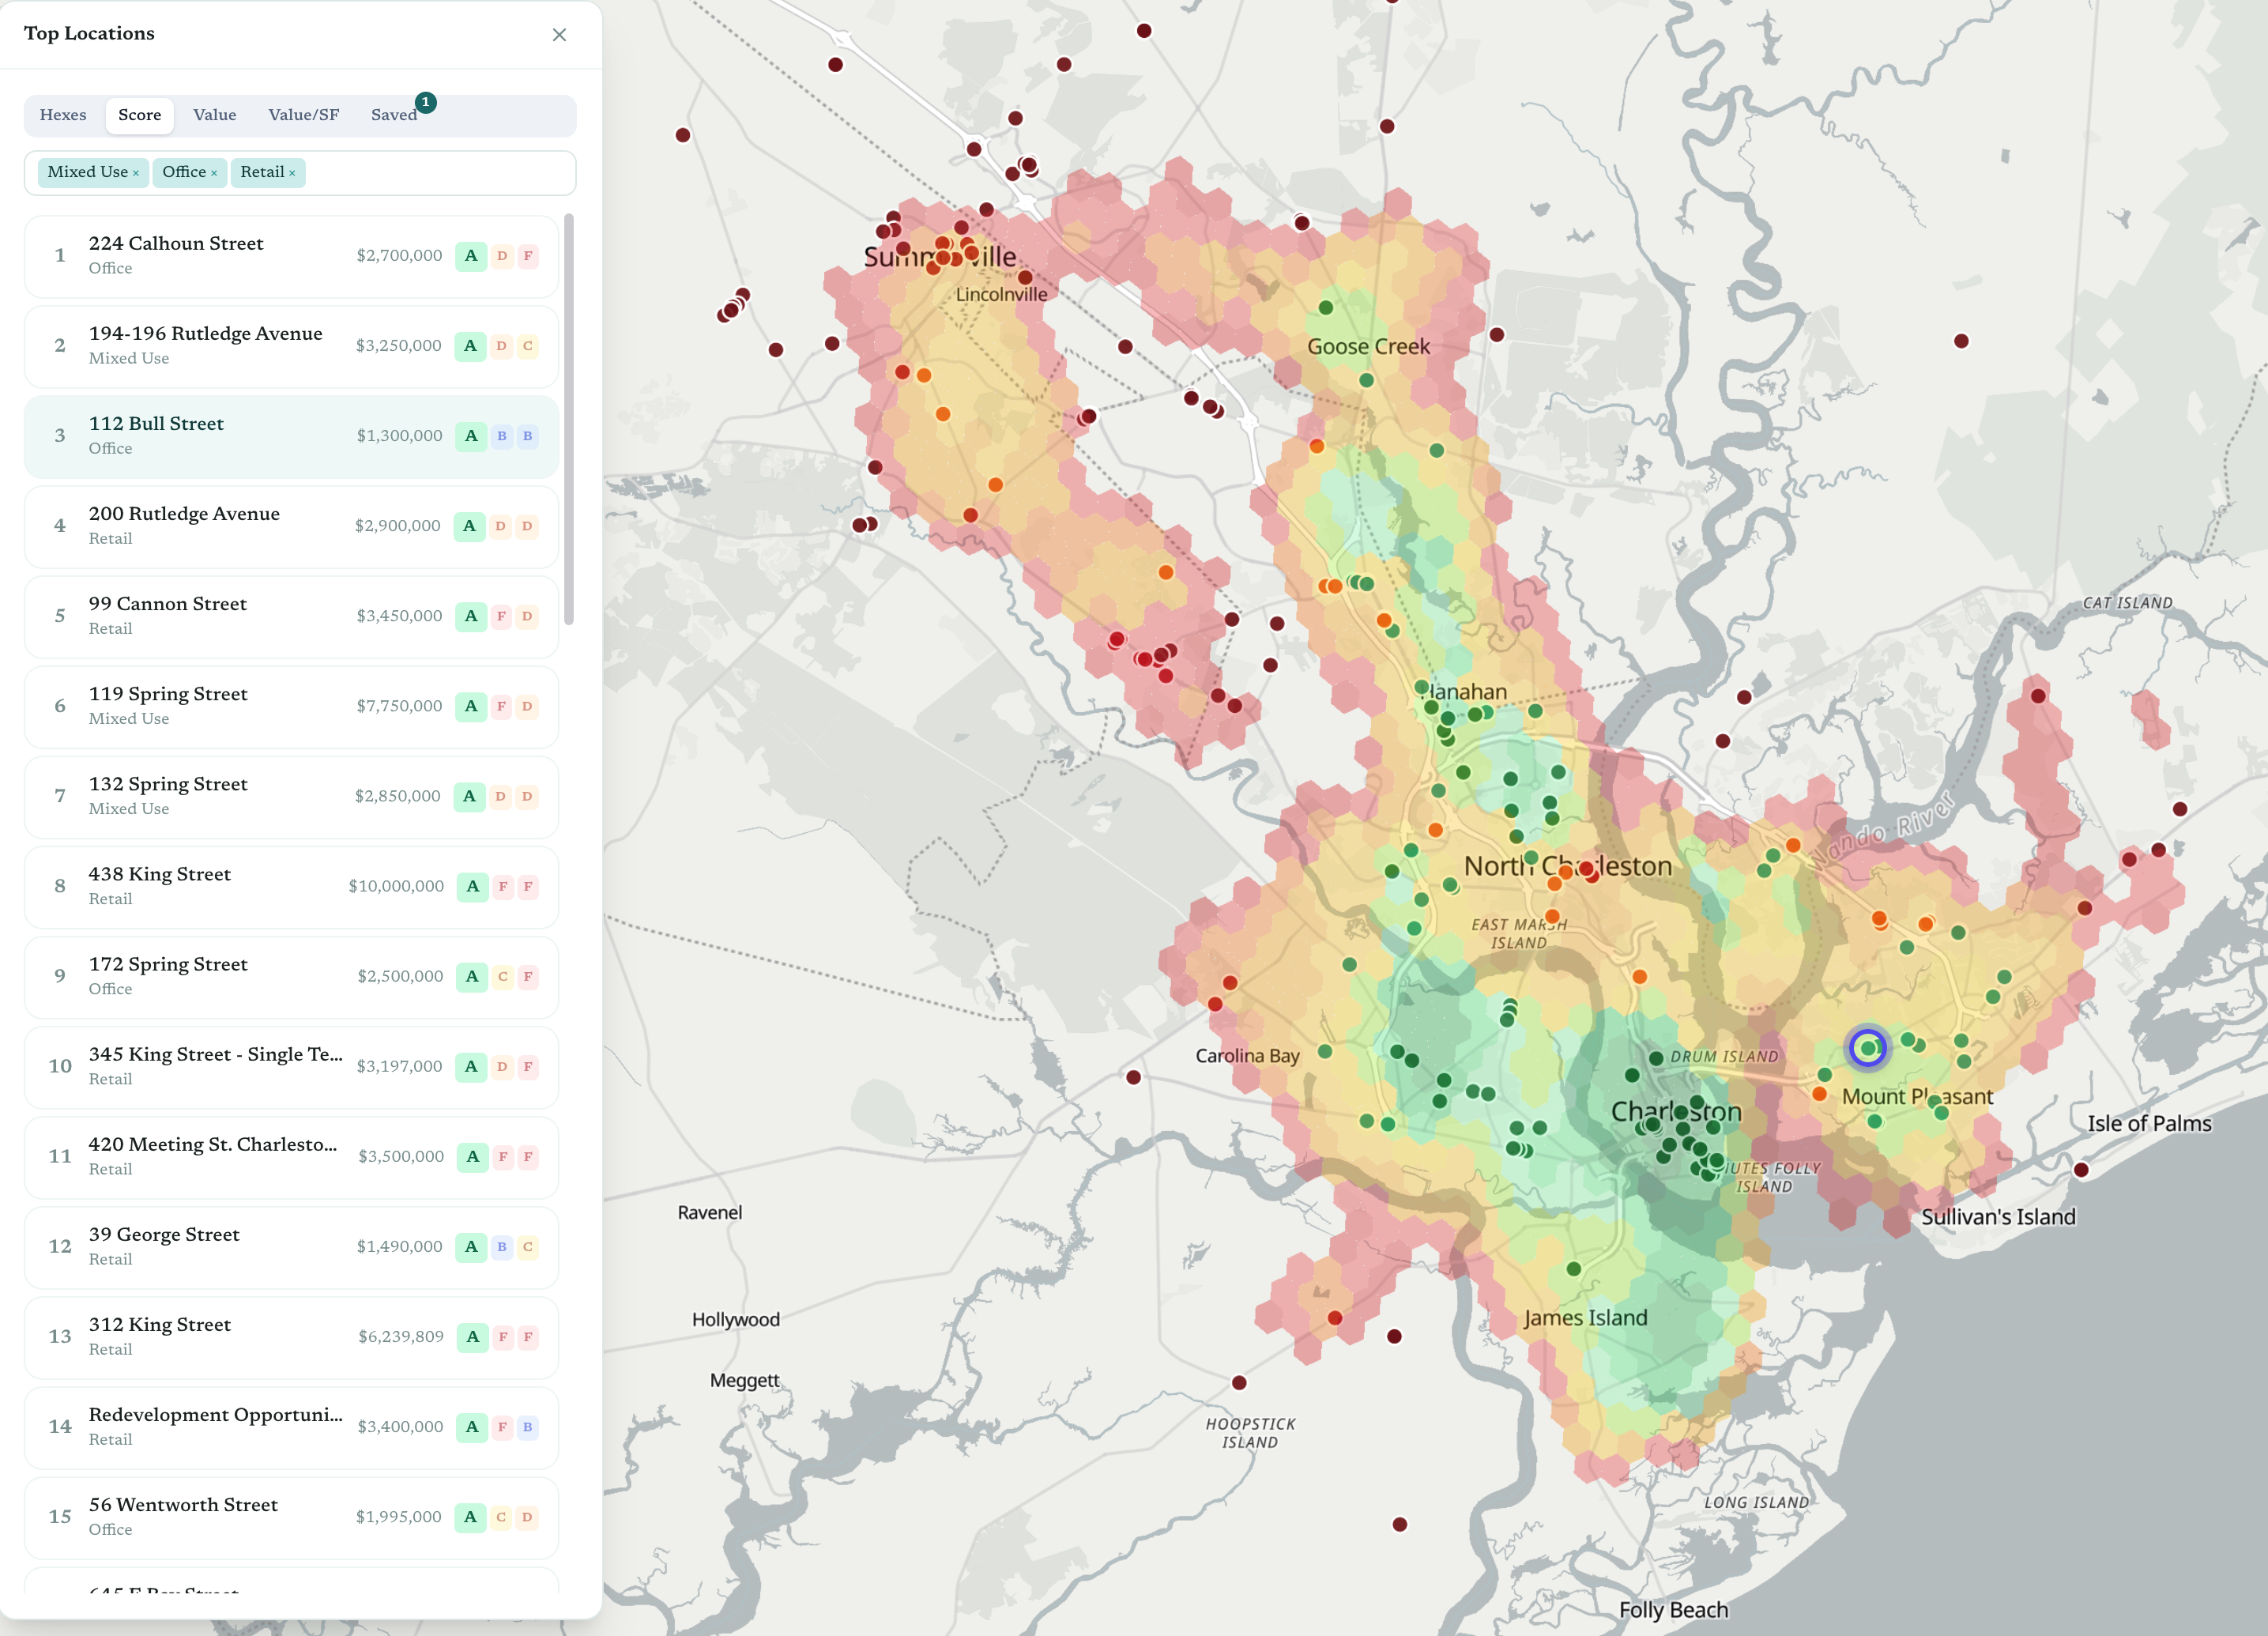
Top Locations
Ranked listings across your entire market.
Sort CRE listings by vibe score, price, or value per square foot. Filter by property type.
Each listing shows a letter grade for score, value, and value/SF — giving you a quick read
on which properties punch above their weight.
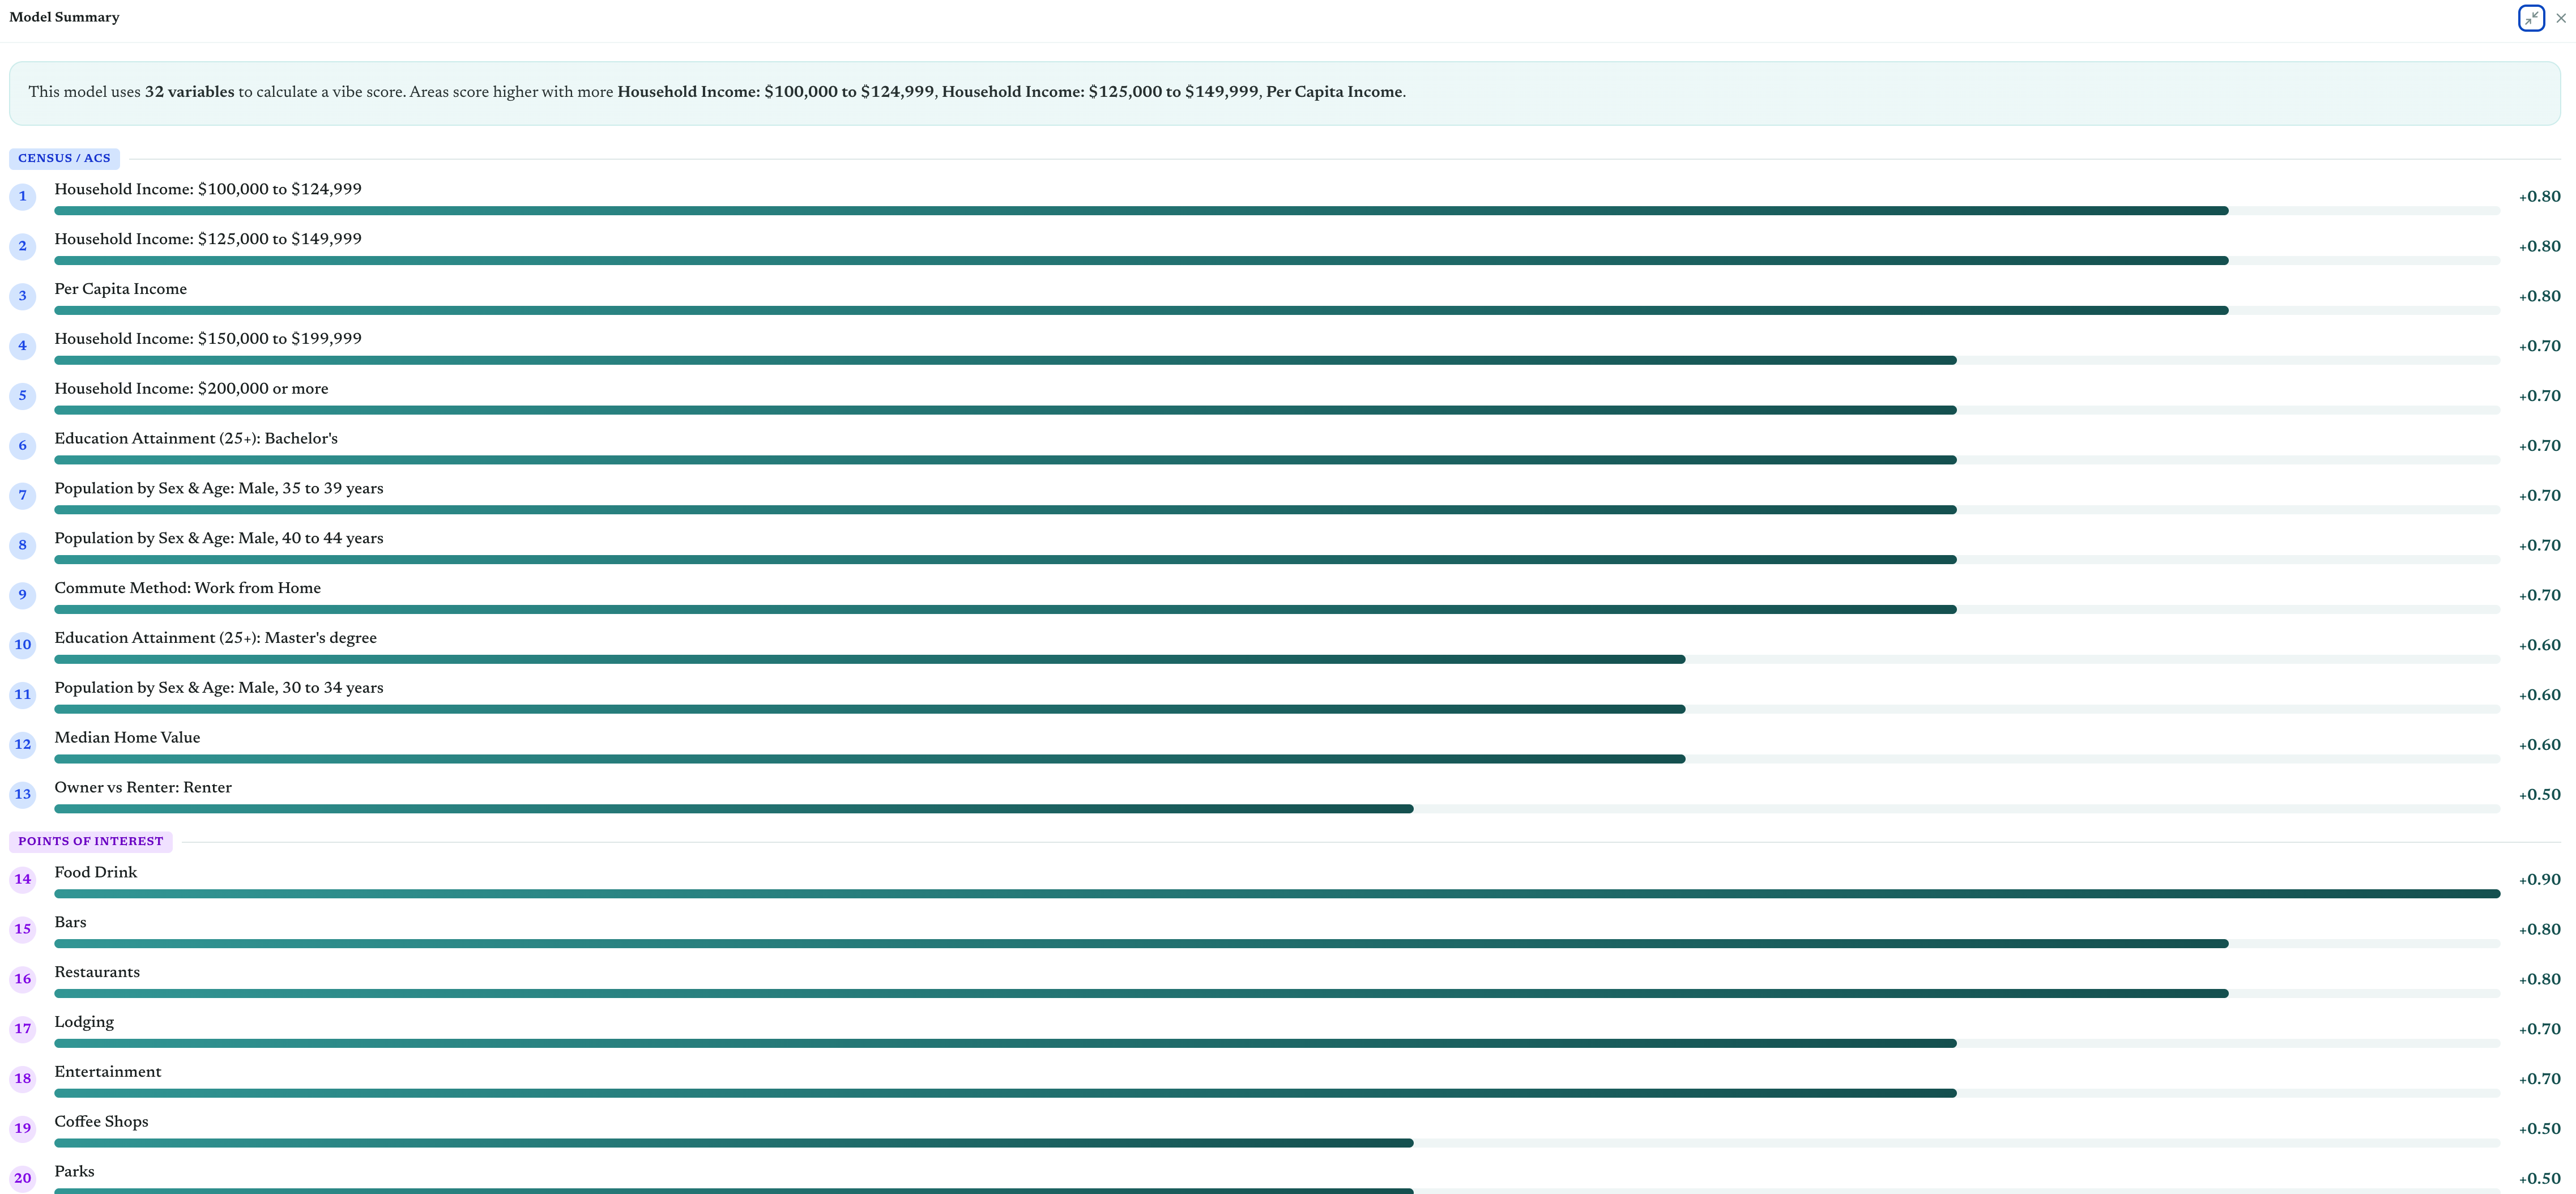
Model Summary
Know exactly what your model values.
Every vibe model produces a ranked variable importance chart showing exactly which factors
drive the score — household income, restaurant density, education levels, commute patterns.
See the weights the model learned from your data, organized by data source.
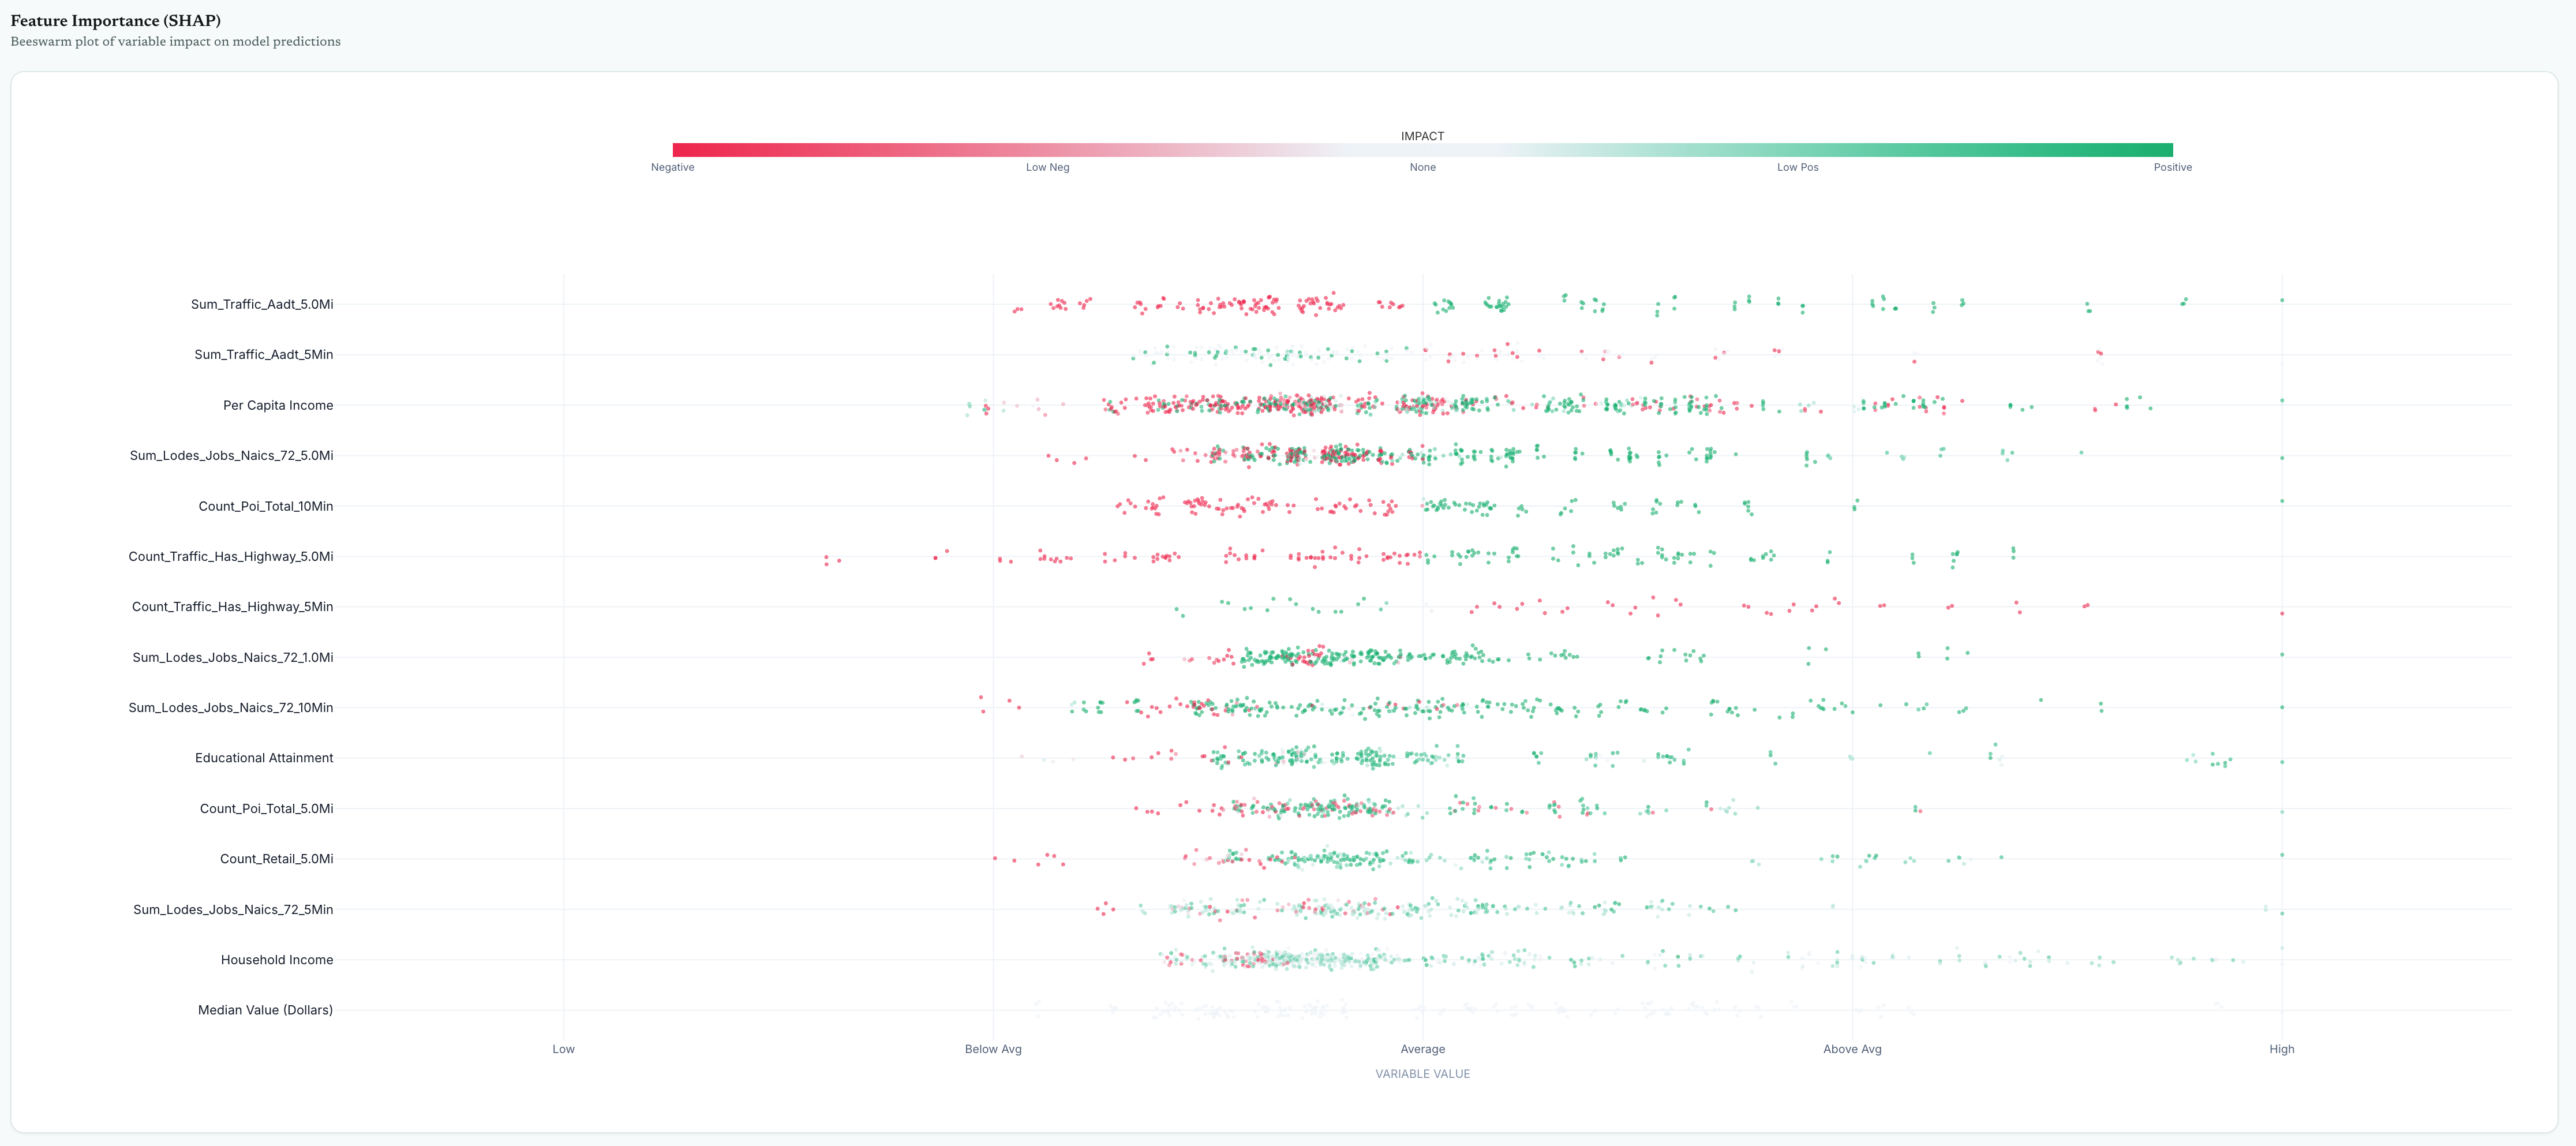
Model Explainability
See which variables move the needle.
Every model explains itself. See exactly which variables push scores up or down — and by how
much — so you can defend site recommendations with data, not intuition.
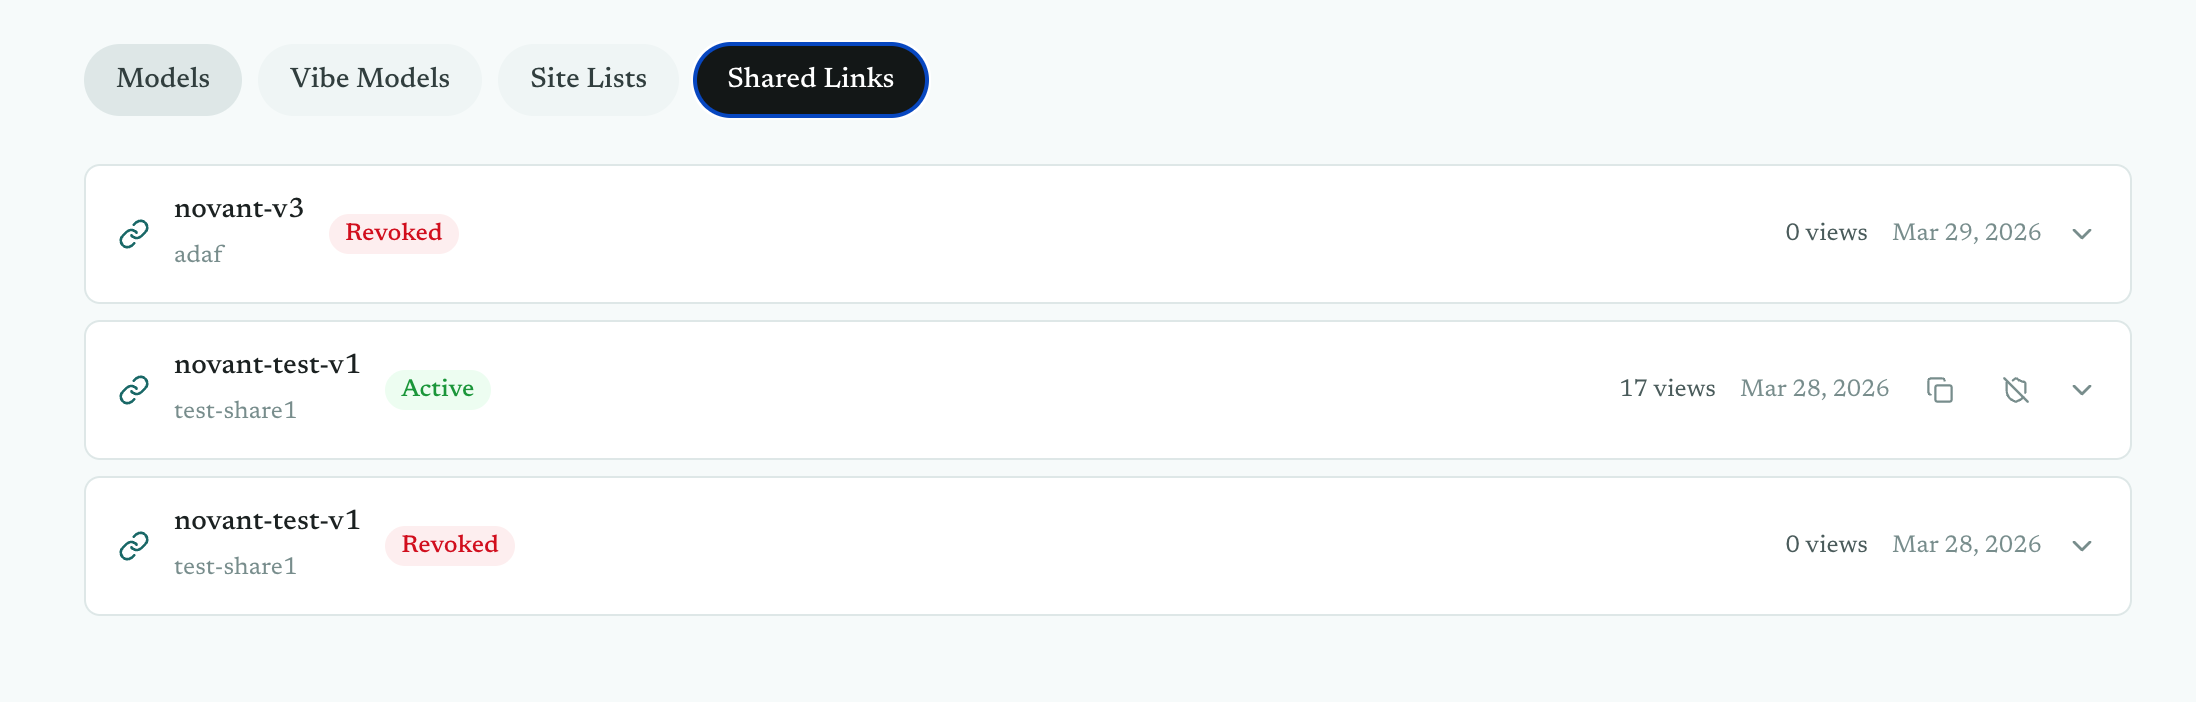
Shareable Maps
Share a live map with anyone.
Generate a shareable link to any vibe model. Recipients get a read-only interactive map
with full scoring, property details, and the hex grid — no account required.
Revoke access anytime. Track views.
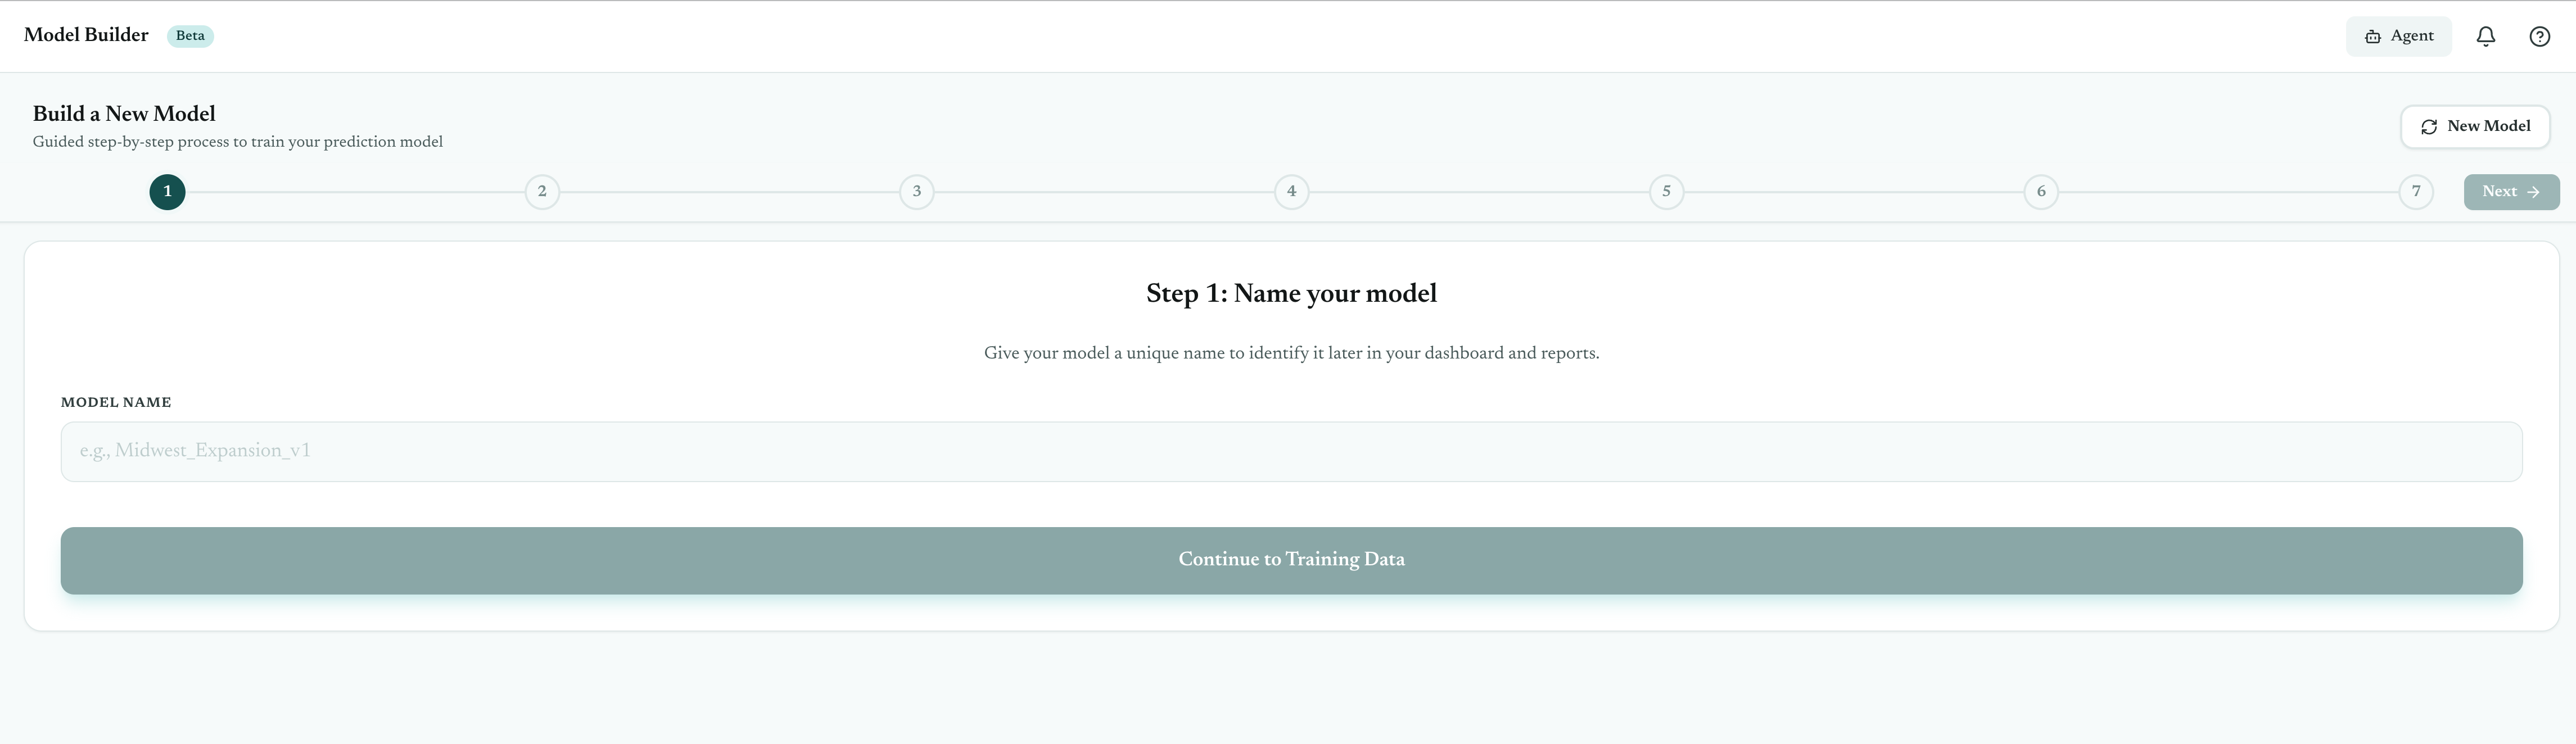
Model Builder
Seven steps from a spreadsheet to your best locations.
Upload your locations, map your score column, pick your variables (or let the AI choose),
and hit build. The pipeline allocates data across your trade areas, trains multiple model
types in parallel, and produces a scoring model you can use to evaluate any new address.
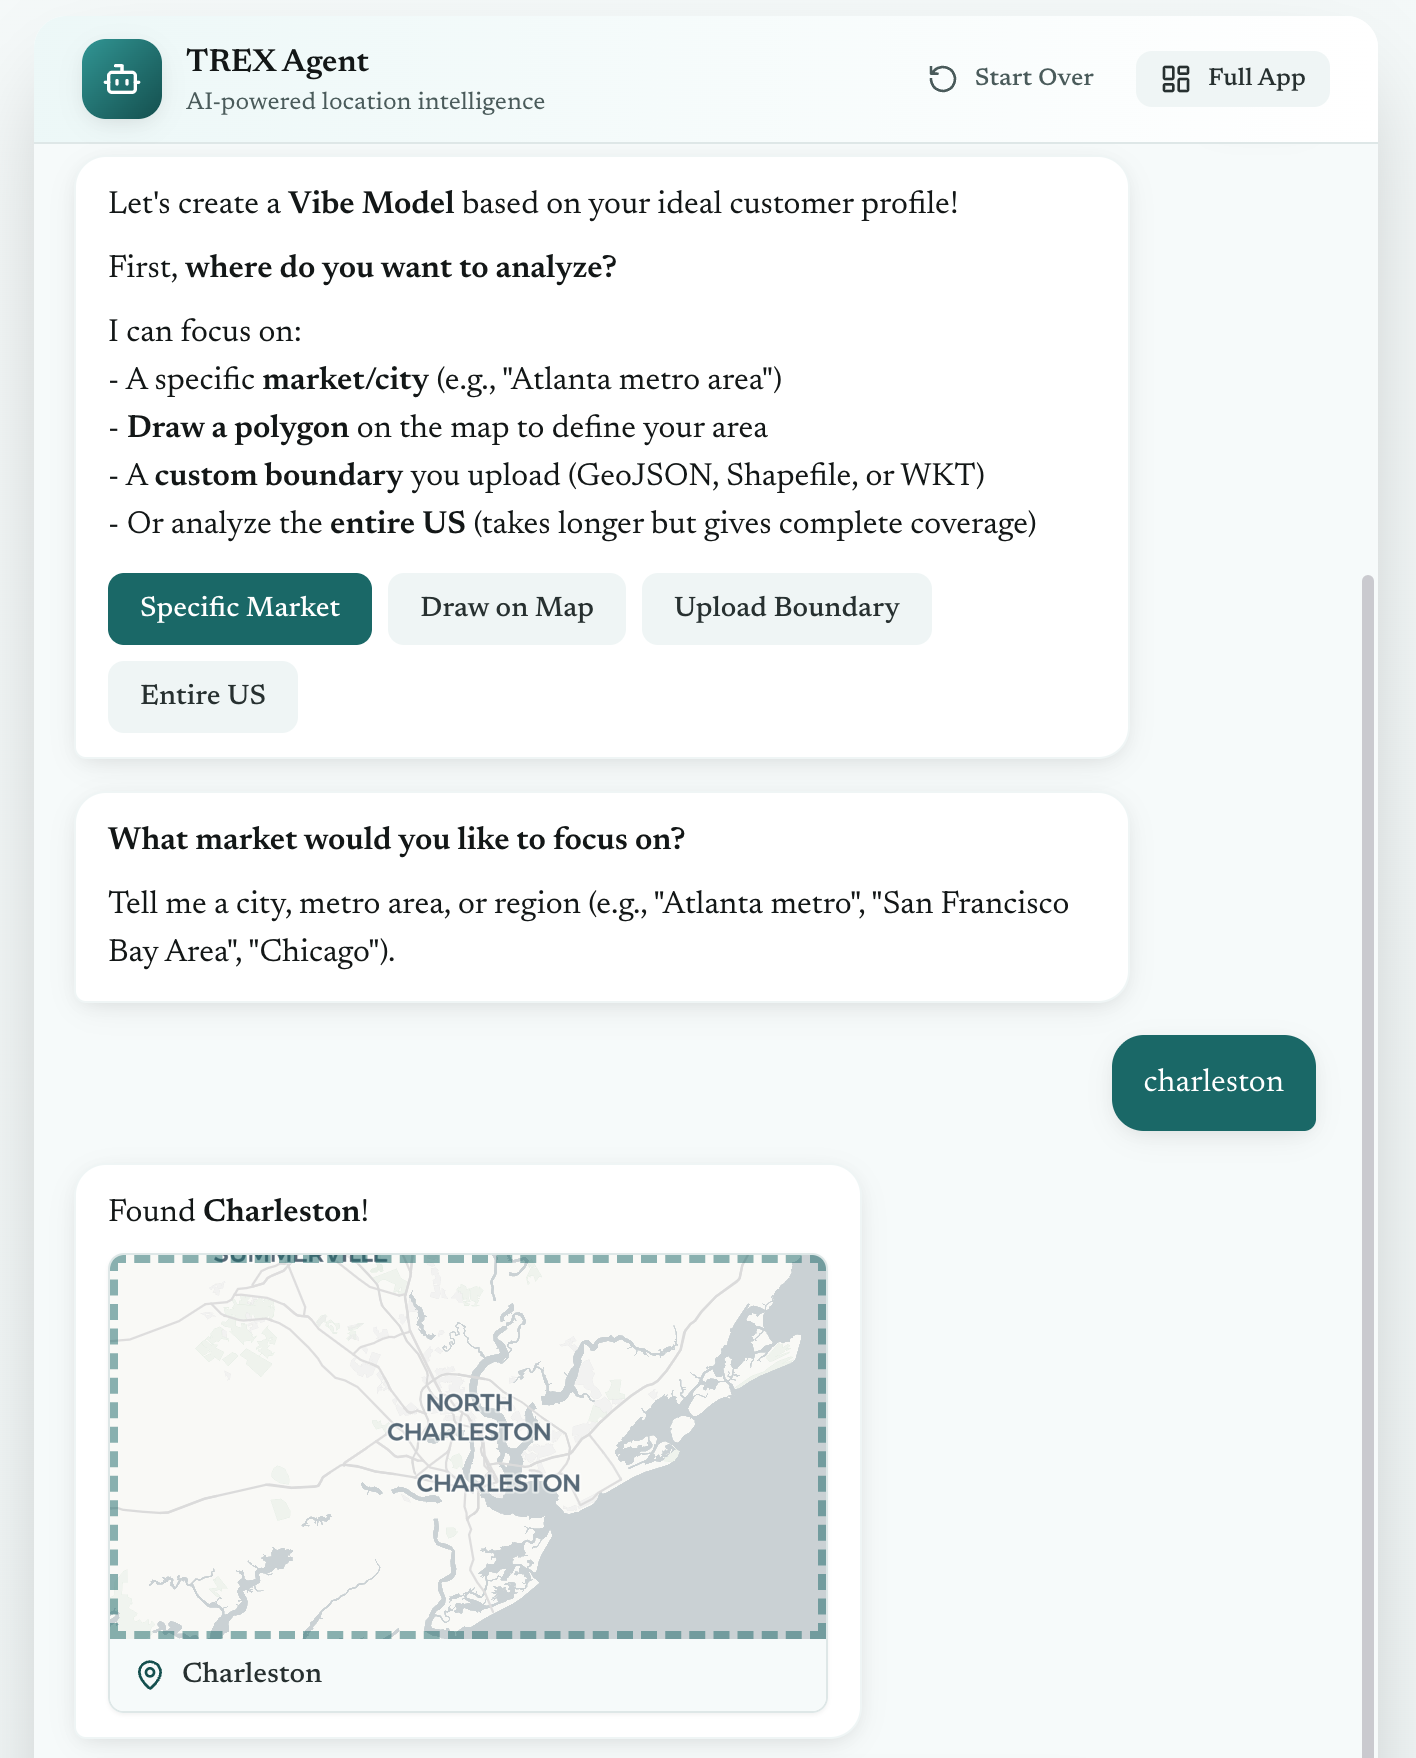
AI Agent
Just tell it what you're looking for.
The TREX Agent walks you through the entire workflow in a chat interface.
Pick a market, describe your customer, and it builds and scores a vibe model
end-to-end — no menus, no configuration screens.
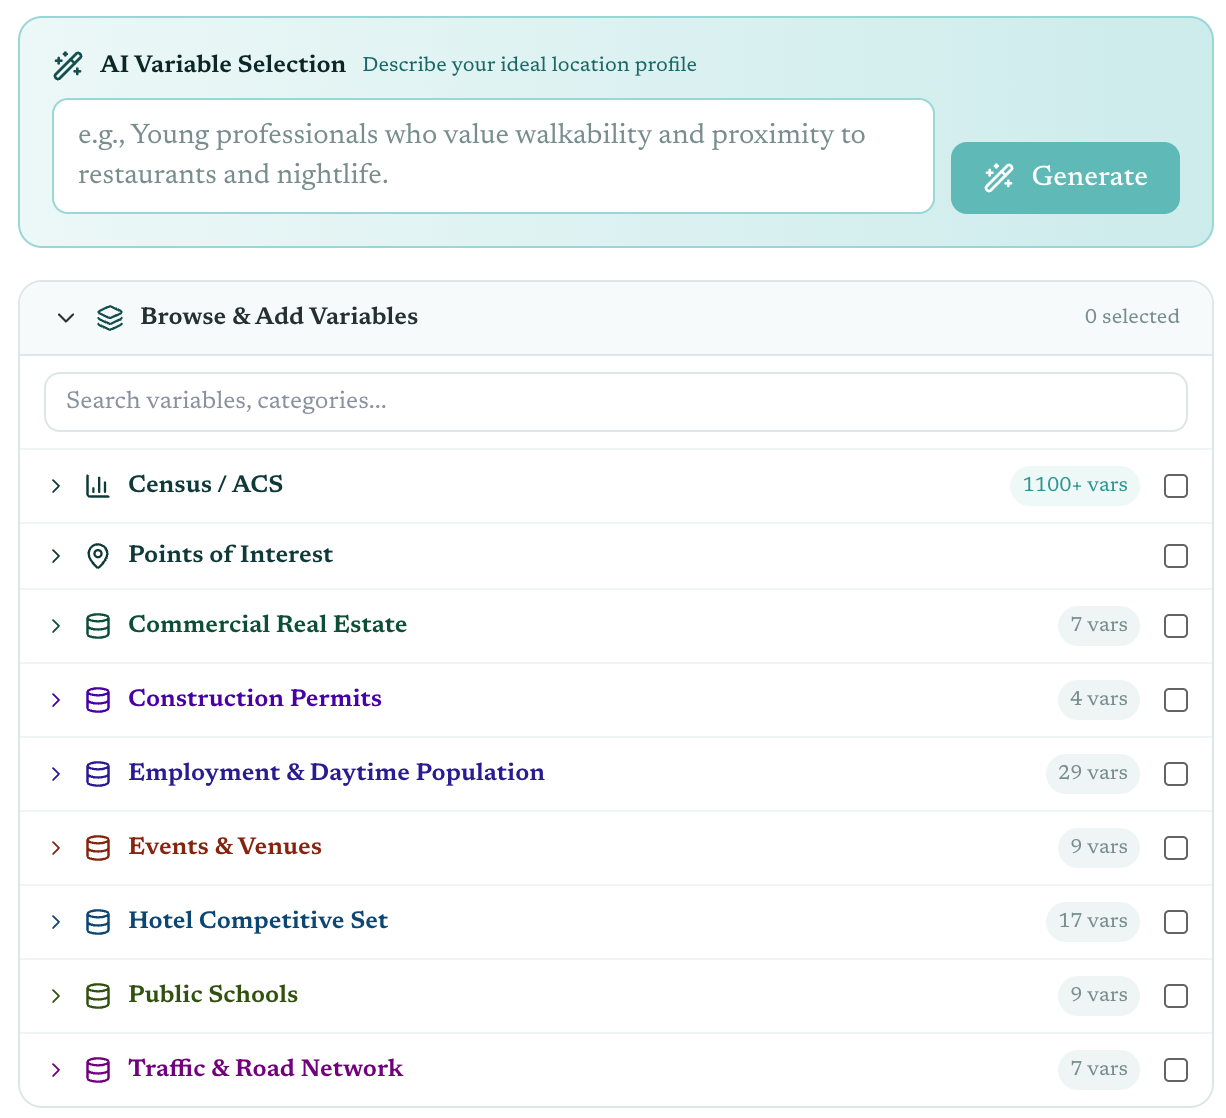
Variable Selection
Let AI pick your variables. Then refine.
Describe your ideal location and the AI selects from 1,100+ census variables,
POI categories, CRE metrics, employment stats, traffic counts, and event data.
Then browse, add, or remove anything — every variable is searchable and grouped by source.